As forest bioeconomy increases, fears have been expressed that the area of clearcut forests increases significantly as well. In reality, however, the area of fellings increases significantly less than the amount of harvested timber in cubic metres.
According to the statistics of the Natural Resources Institute Finland, the amount of harvested timber in cubic metres does not change in the same way as the harvested area changes, especially when it comes to regeneration fellings. This means that the area of harvested forest does not necessarily increase if the harvested amount of timber increases.
This is because the growing stock in Finnish forests has increased, since forests are denser and the trees in the forests are larger than previously. The growing stock has increased from 1,700 million cubic metres in 1980s to currently already 2,500, although the forest area in Finland has remained more or less the same.
According to the Natural Resources Institute Finland, the average amount of timber per hectare on productive and poorly productive forests has increased by over 44 percent in southern and by 72 percent in northern Finland. The average of the whole country is 51 percent.
Also, the plans to increase loggings due to the increasing bioeconomy do not imply as large an increase in the harvested area. According to the estimate of the Natural Resources Institute Finland and the Finnish Environment Institute, the area of regeneration fellings would increase by 11 percent to 173,000 hectares and the area of thinnings by 0.4 percent to 467,000 hectares annually.
But looking at cubic metres, the increase target has been set to over one fifth.
Harvested area describes the impact on nature more accurately
This means that the effect of loggings on biodiversity is not as significant, as would be the case if the average amount of timber per hectare had not increased, as now the loggings can be carried out on a smaller area. This provides more options for biodiversity protection.
Especially the possibilities for nature management in commercial forests are more diverse, when you, for example, can leave more retention trees unfelled in conjunction to regeneration fellings or in the special habitats that should be protected according to the Forest Act.
According to the researchers who carried out the research of the endangered species in Finland, retention trees are the largest single reason for the fact that the general status of endangered forest species in Finland did not decrease during the first decade of 2000s in Finland.
Despite loggings, also the carbon amount of soil increases when the growing stock increases. Looking at a single forest compartment, it follows the amount of timber with a delay of some years. This is because on heathlands, the greatest share of the carbon in the soil is created from the litter from the trees, such as needles, small branches and parts of the roots.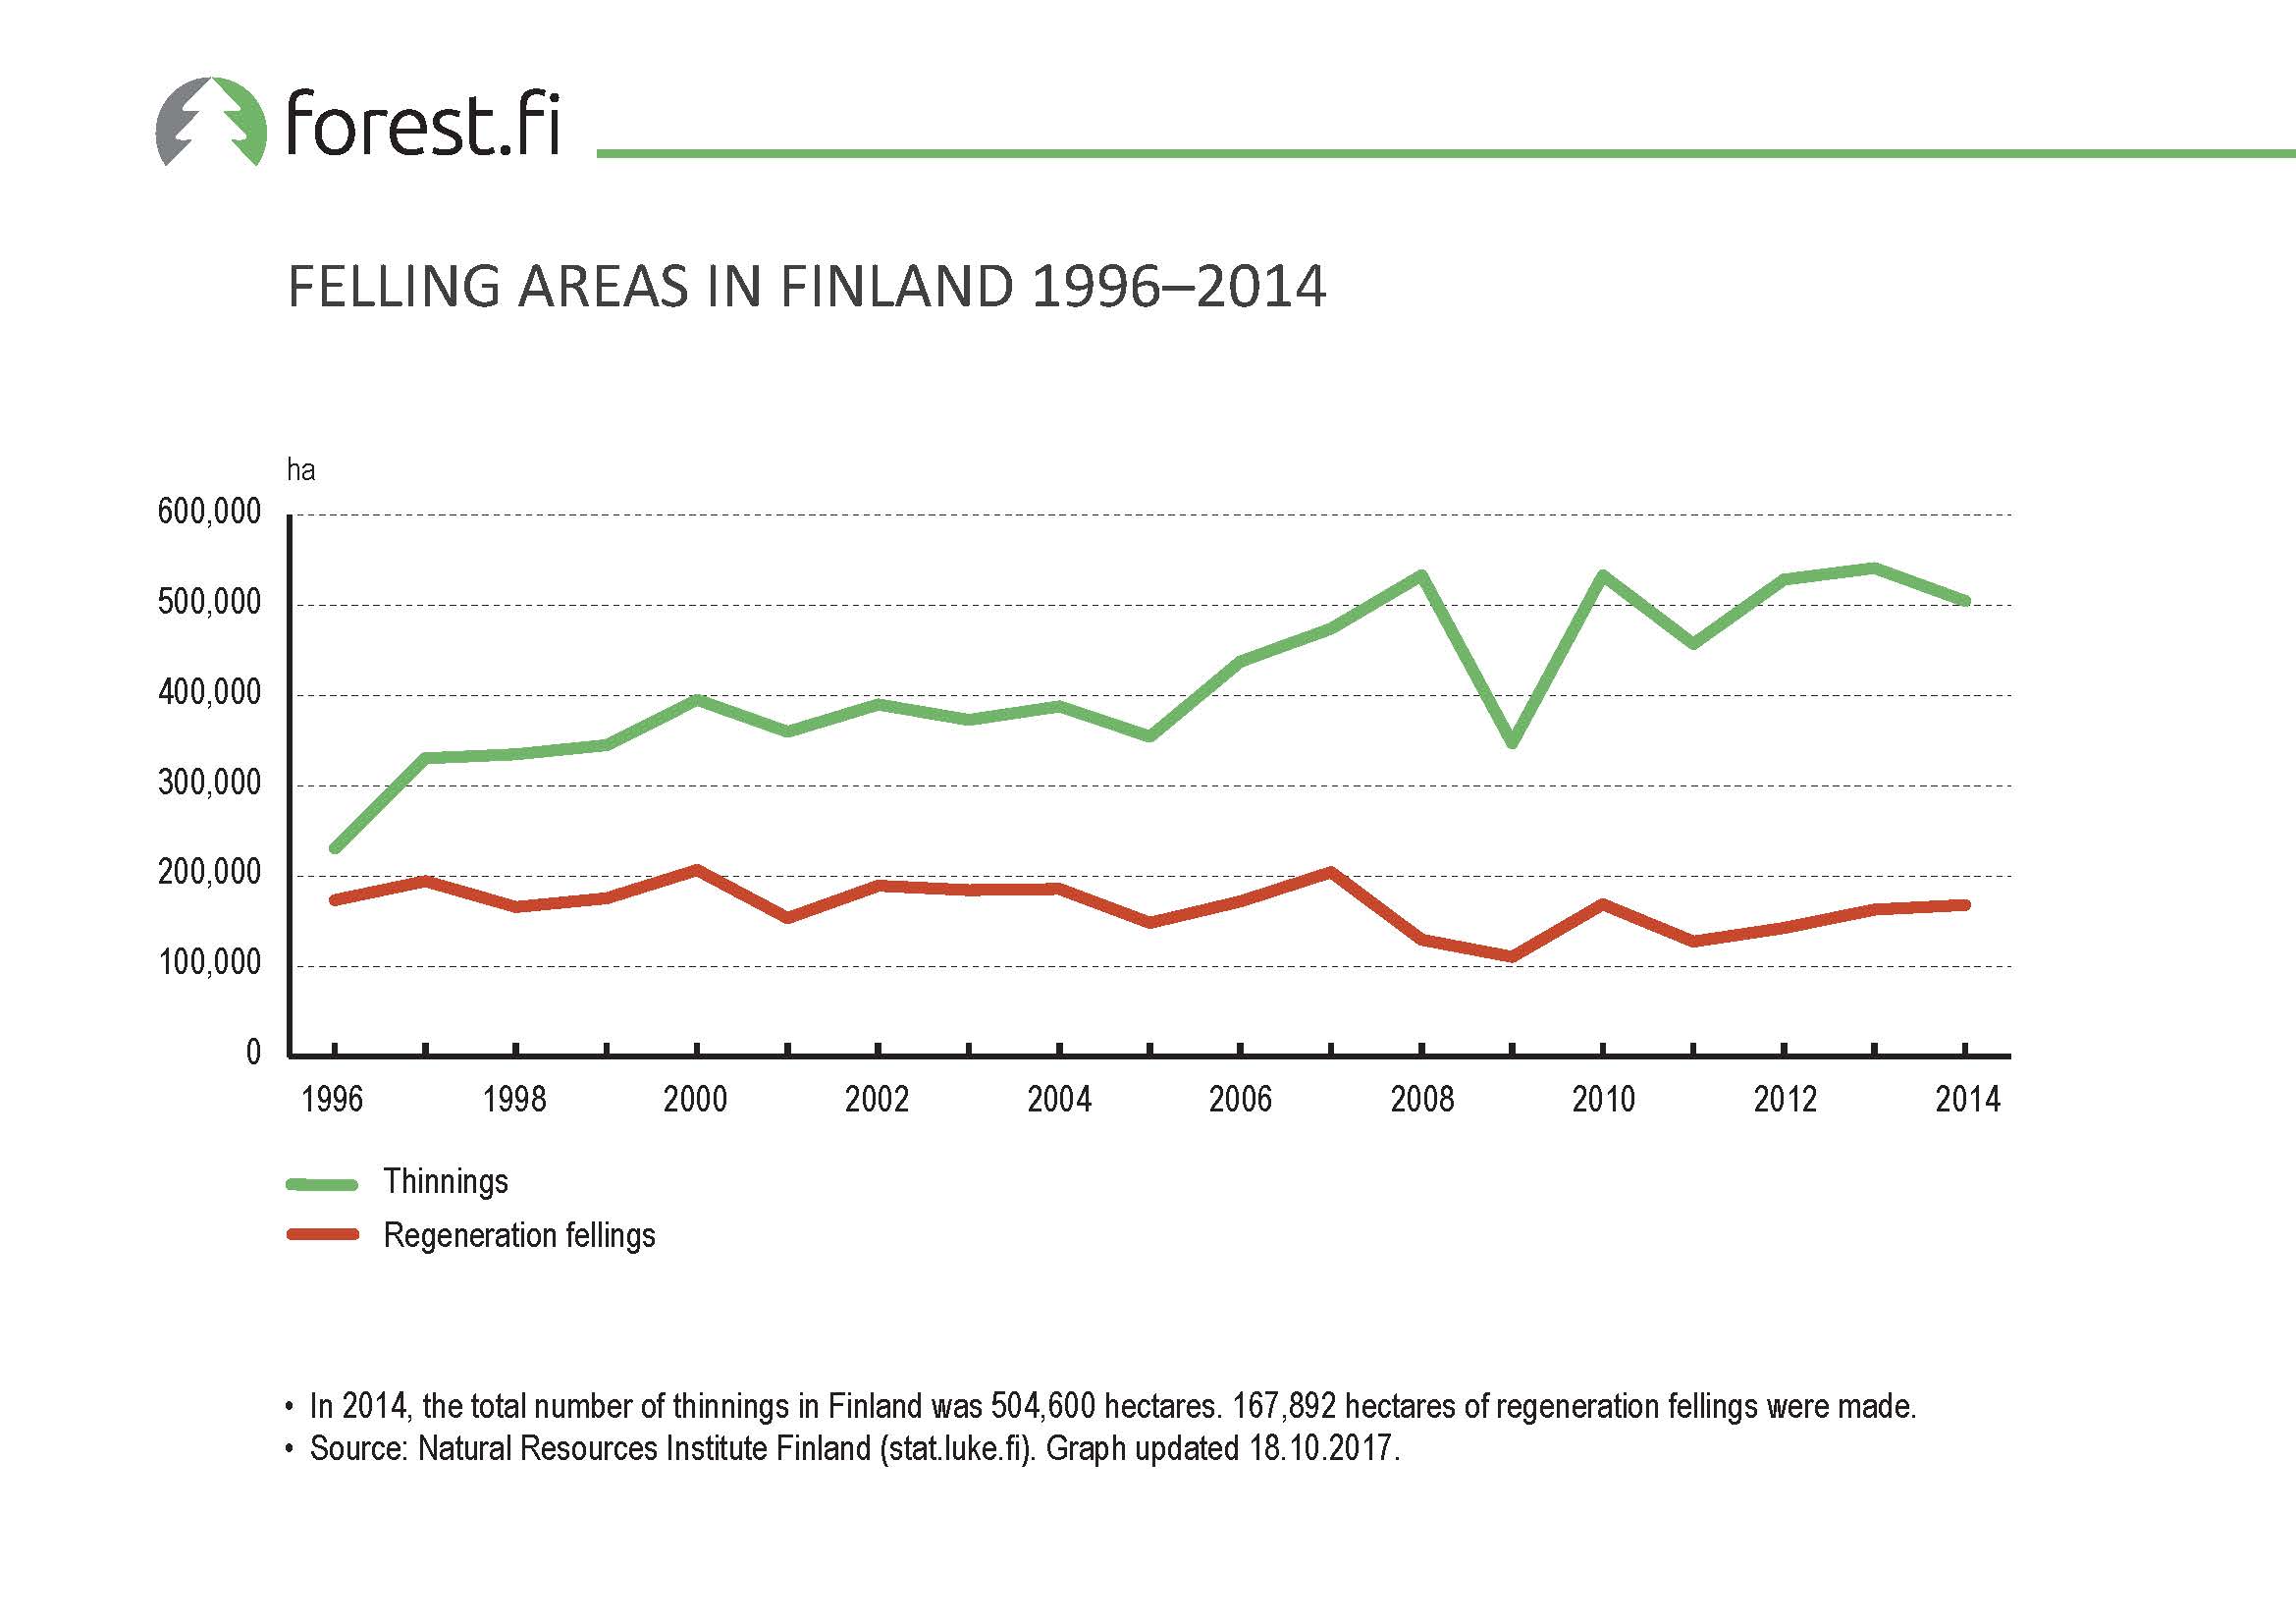
Finland – a mosaic of protected areas
We have updated the graph previously known with the title Distance to protected areas in Finland. The idea of the graph has been slightly changed, according to its new name: Distance between protected areas in Finland.
From the graph attached at the end of this article you can see that there are very few areas in Finland where the distance between protected areas is more than ten kilometres. In many of these areas the distance, however, is smaller.
This is due to the source information of the map being from the state forest company Metsähallitus. The information covers only the state-owned protected areas. However, there are many privately-owned protected areas as well those established by, for example, municipalities, as such the Puijo area in Kuopio, central Finland, in one of the white areas of the map.
In addition to this, many large lakes can be perceived on the map as areas where the distance between protected areas is long.